When you click on links to various merchants on this site and make a purchase, this can result in this site earning a commission. Affiliate programs and affiliations include, but are not limited to, the eBay Partner Network.
I know. You already said that. Maybe the sensor isn't the problem. Maybe the wiring is damaged or there's an exhaust leak. Who knows.
It still would helpful to see the graphs. Something doesn't look right to me.
We are diagnosing here, right? Not firing the parts gun and hoping for the best.
yes I will graph it and get back to you all.
Thanks for the help
Piston app. wouldn't do graphs so I got the Toqure Pro. Trying to get use to the app and don't really know what I'm looking at. So please be patient. This is idle in drive Idle in drive
ok it's a bit of a mess.
Before taking any readings, let the engine warm up fully to operating temperature and make sure fuel metering is running in closed loop.
Does the software allow you to put both Bank 1 & 2 on the same graph? If yes do that, and ideally put ECT on there too.
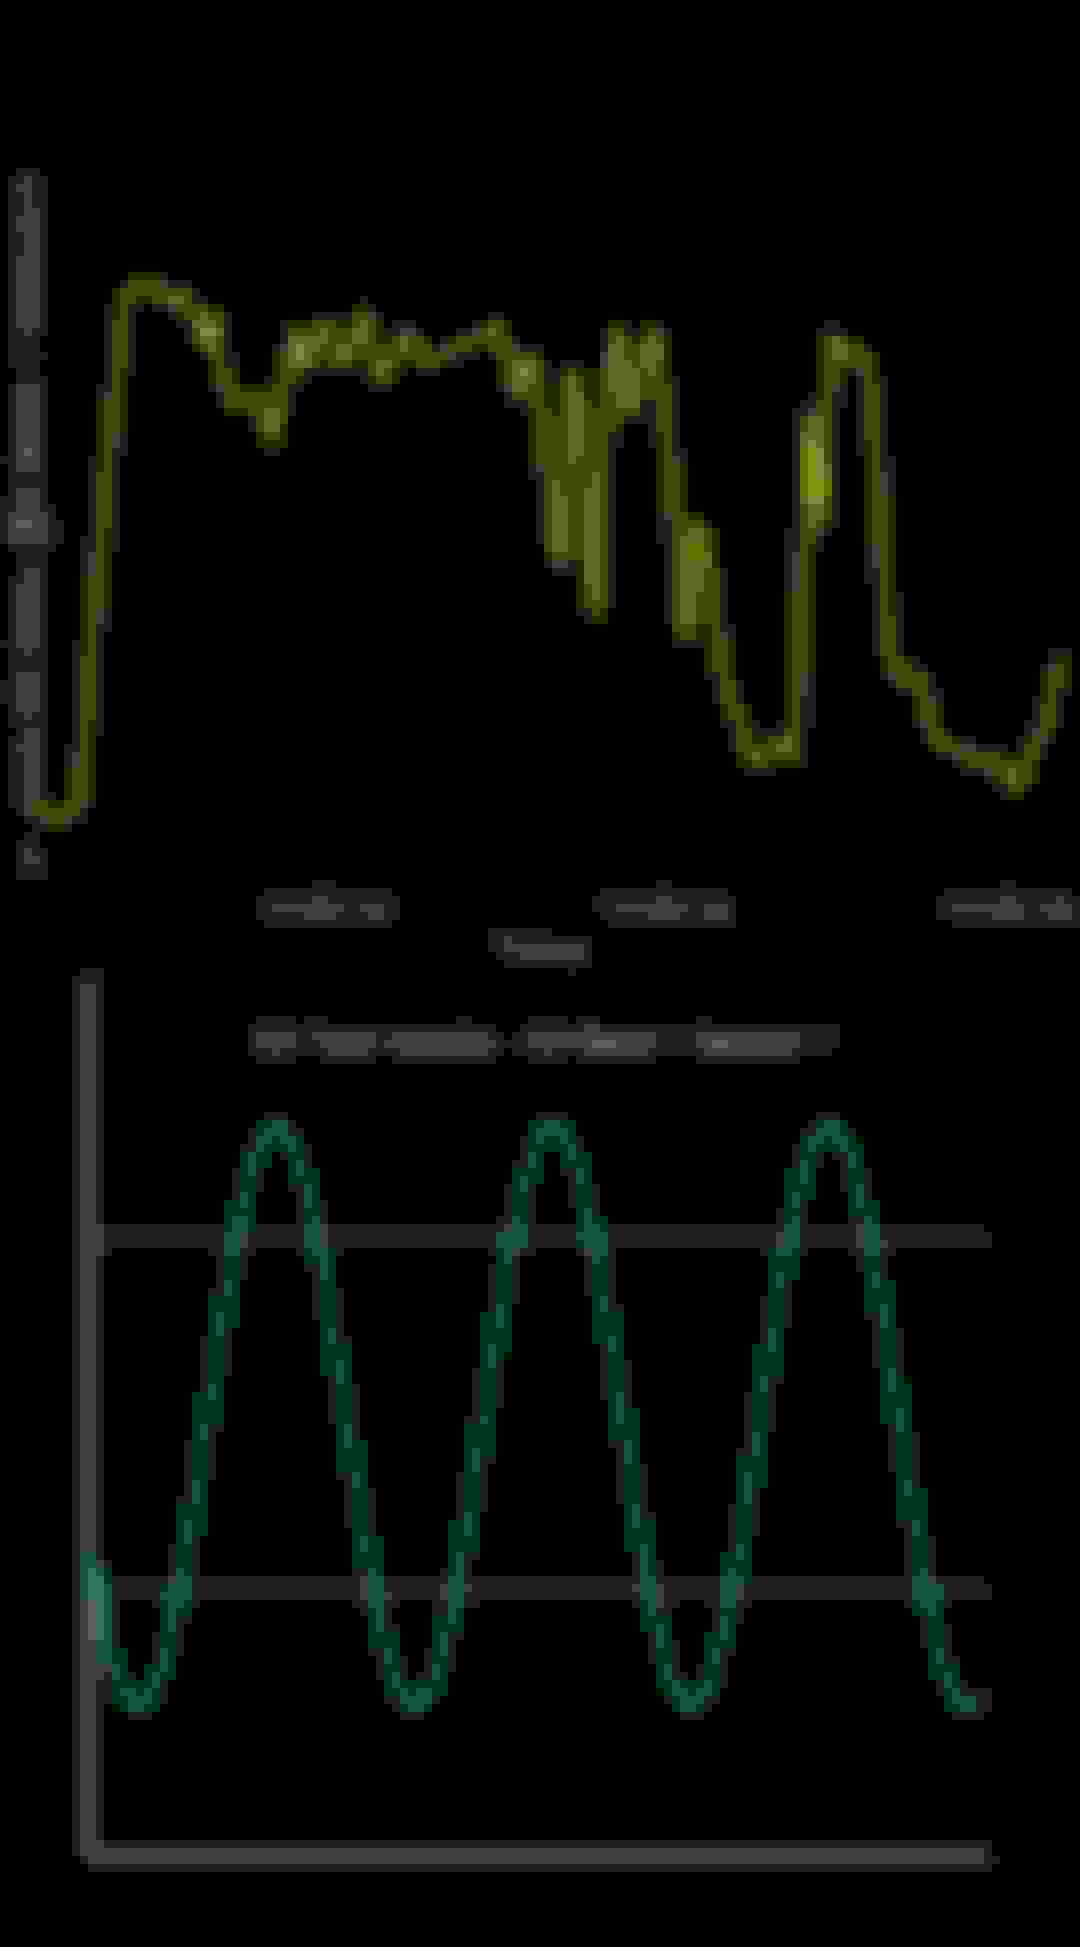
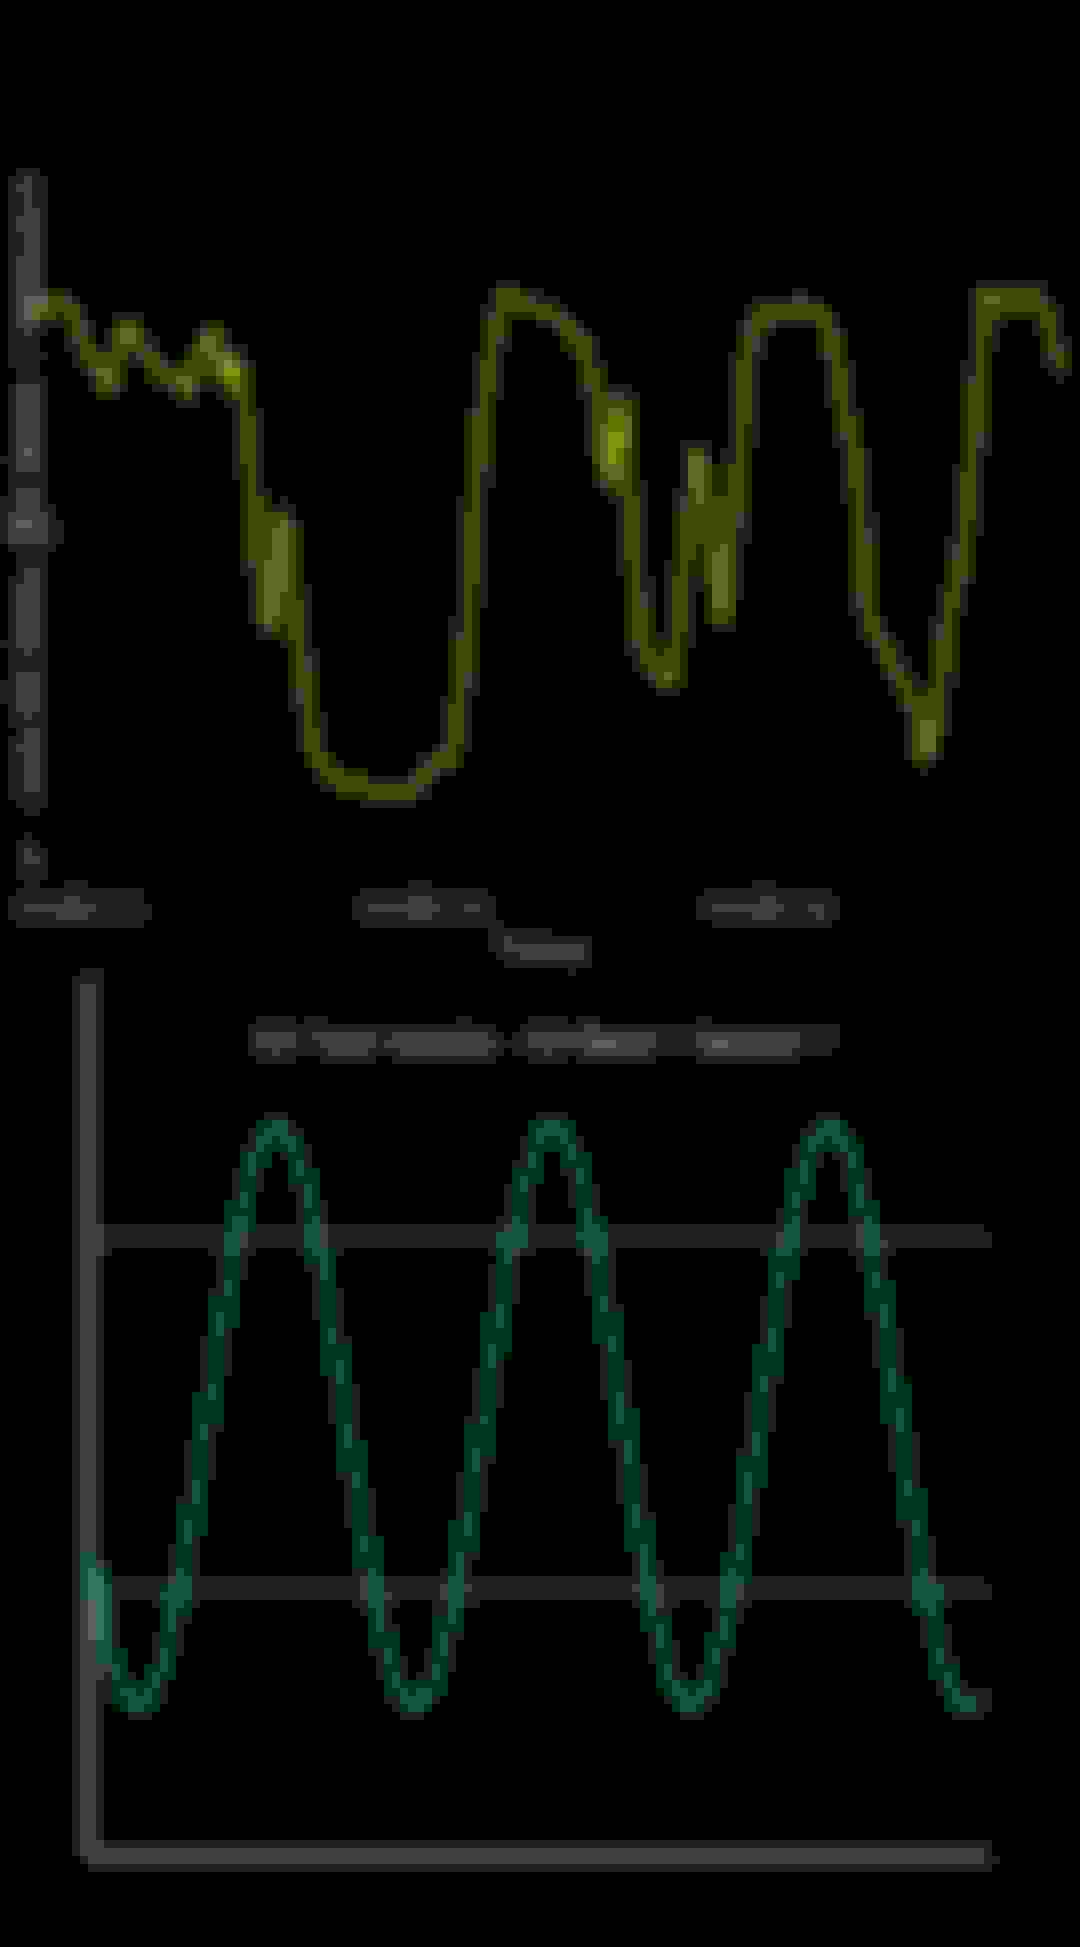
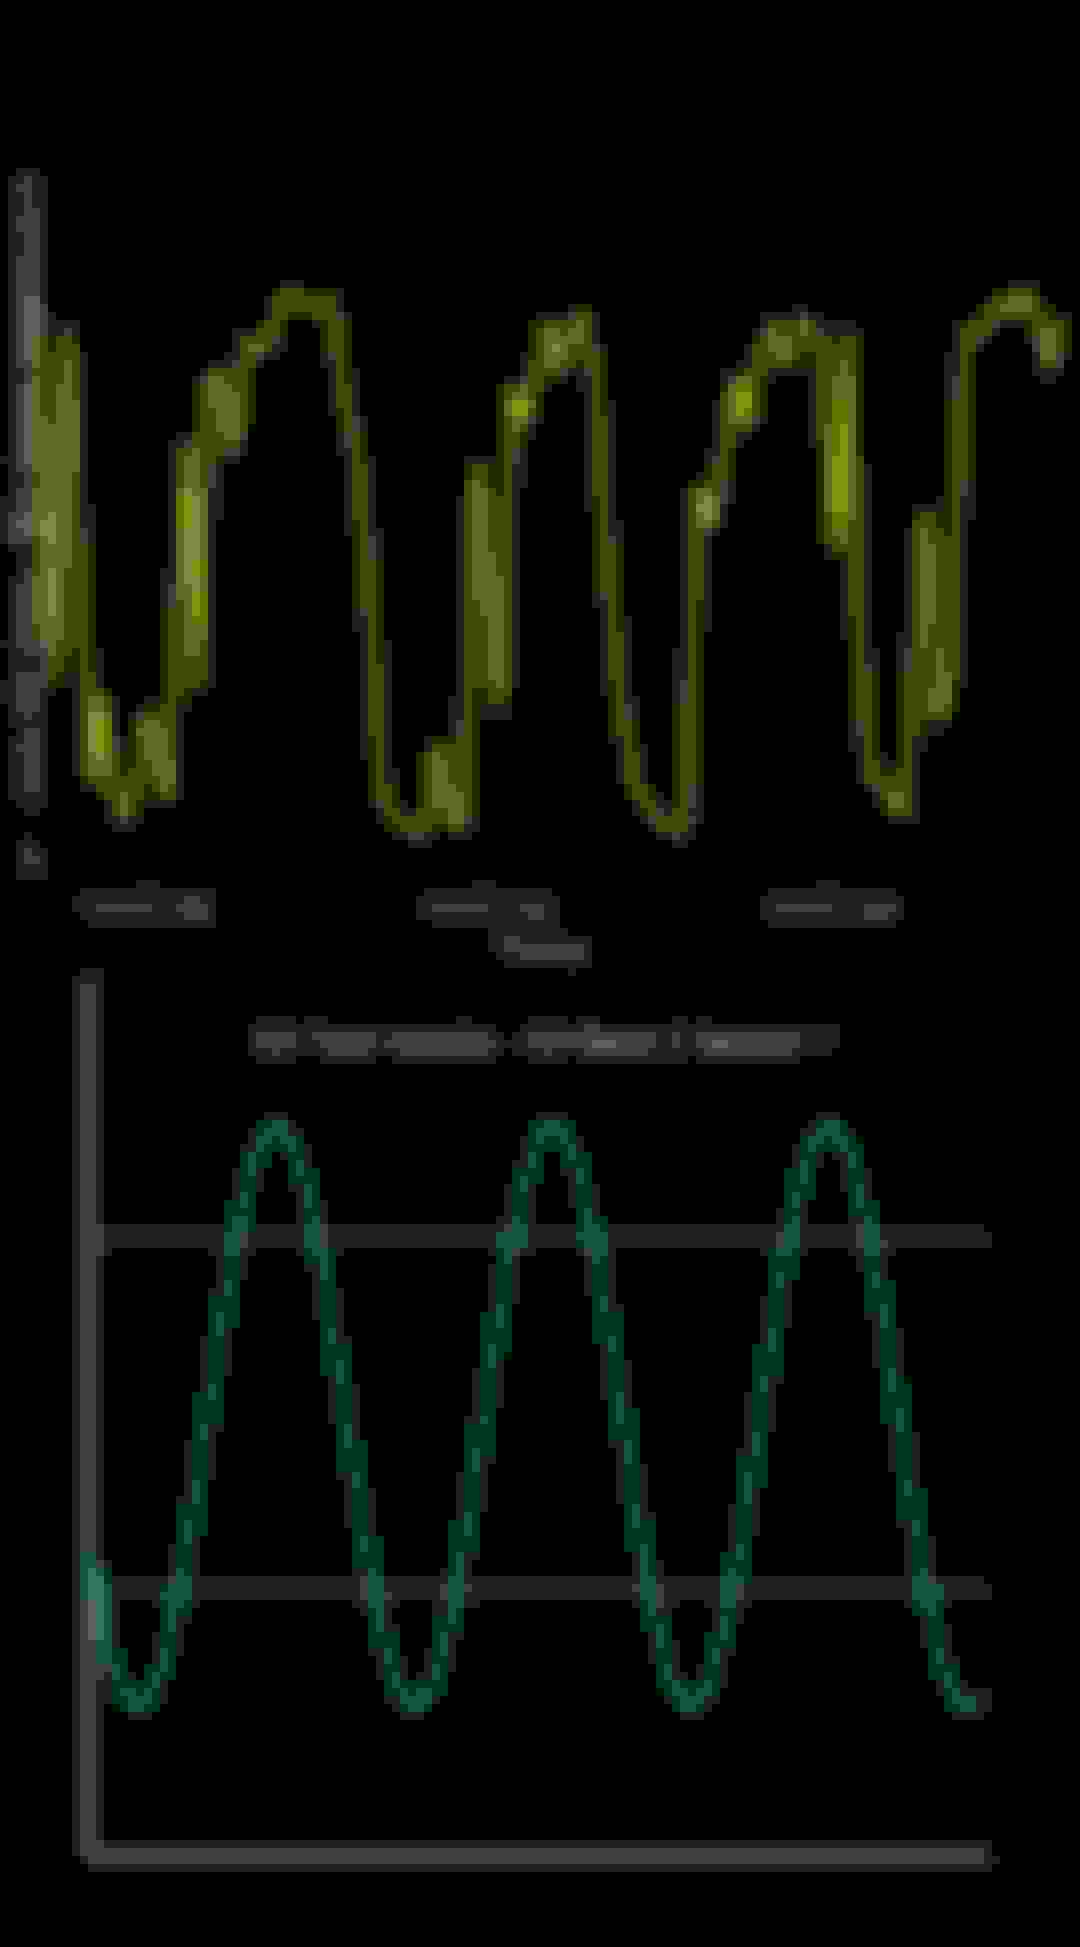
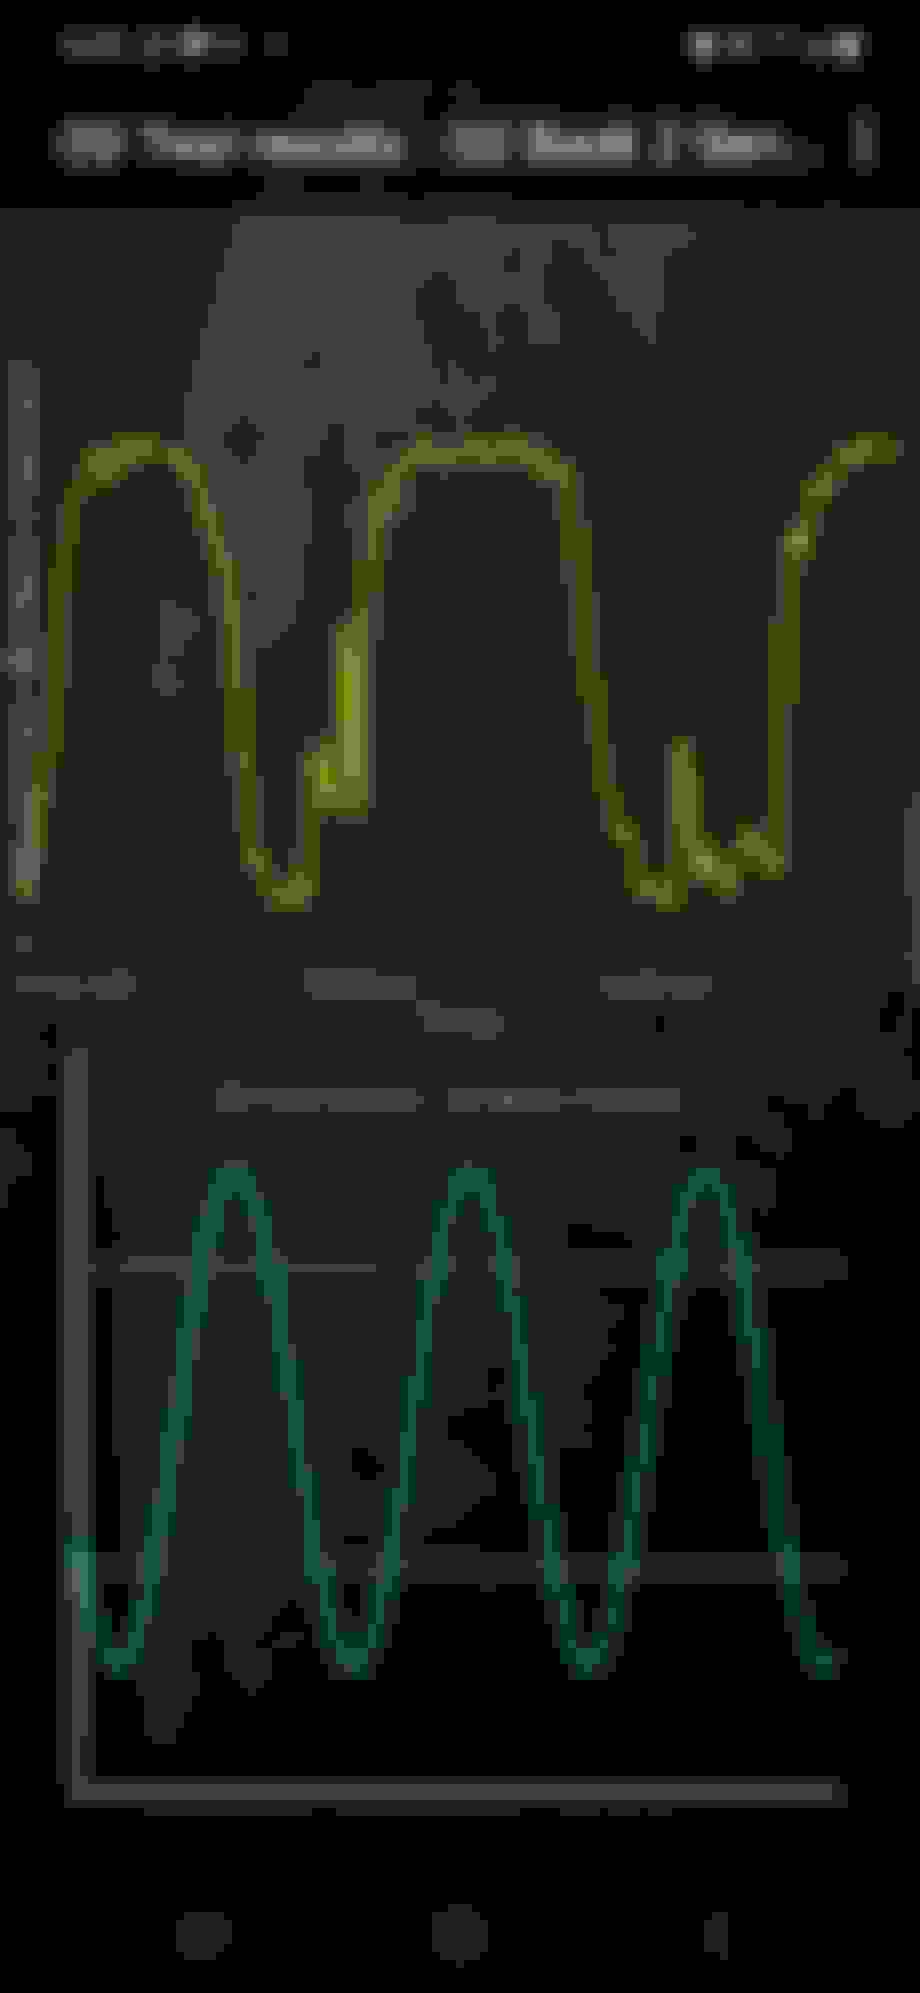
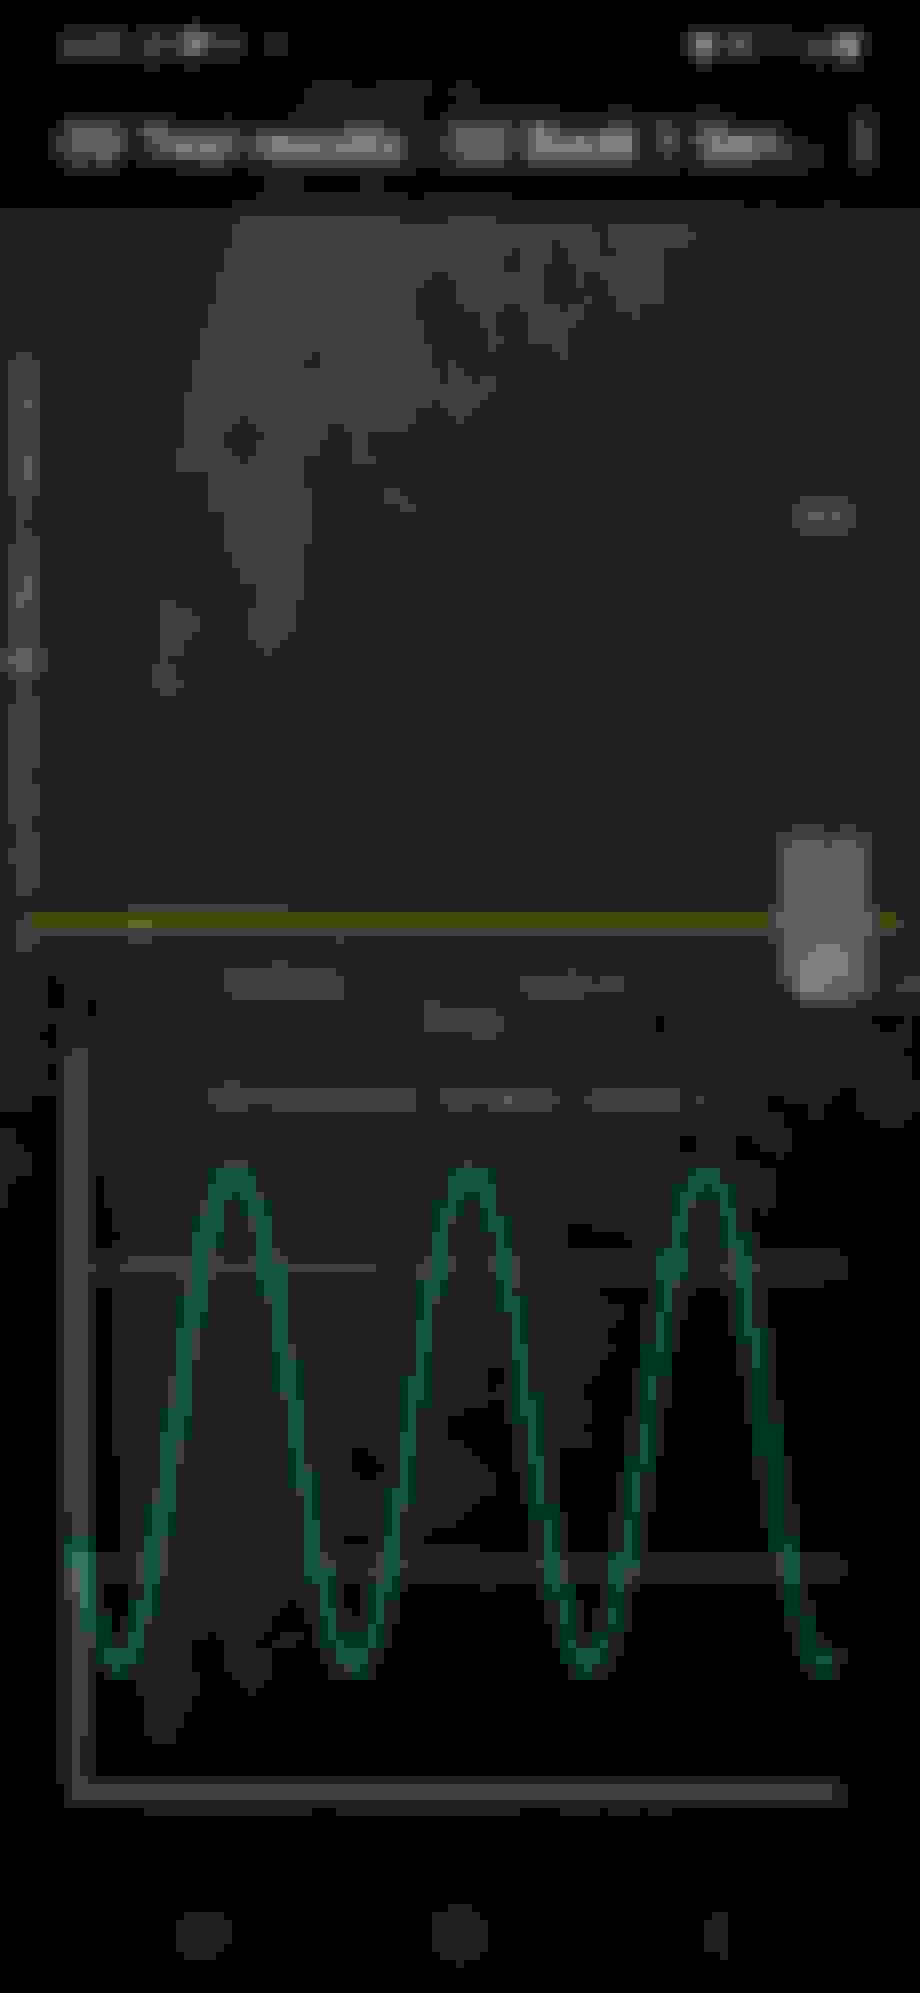
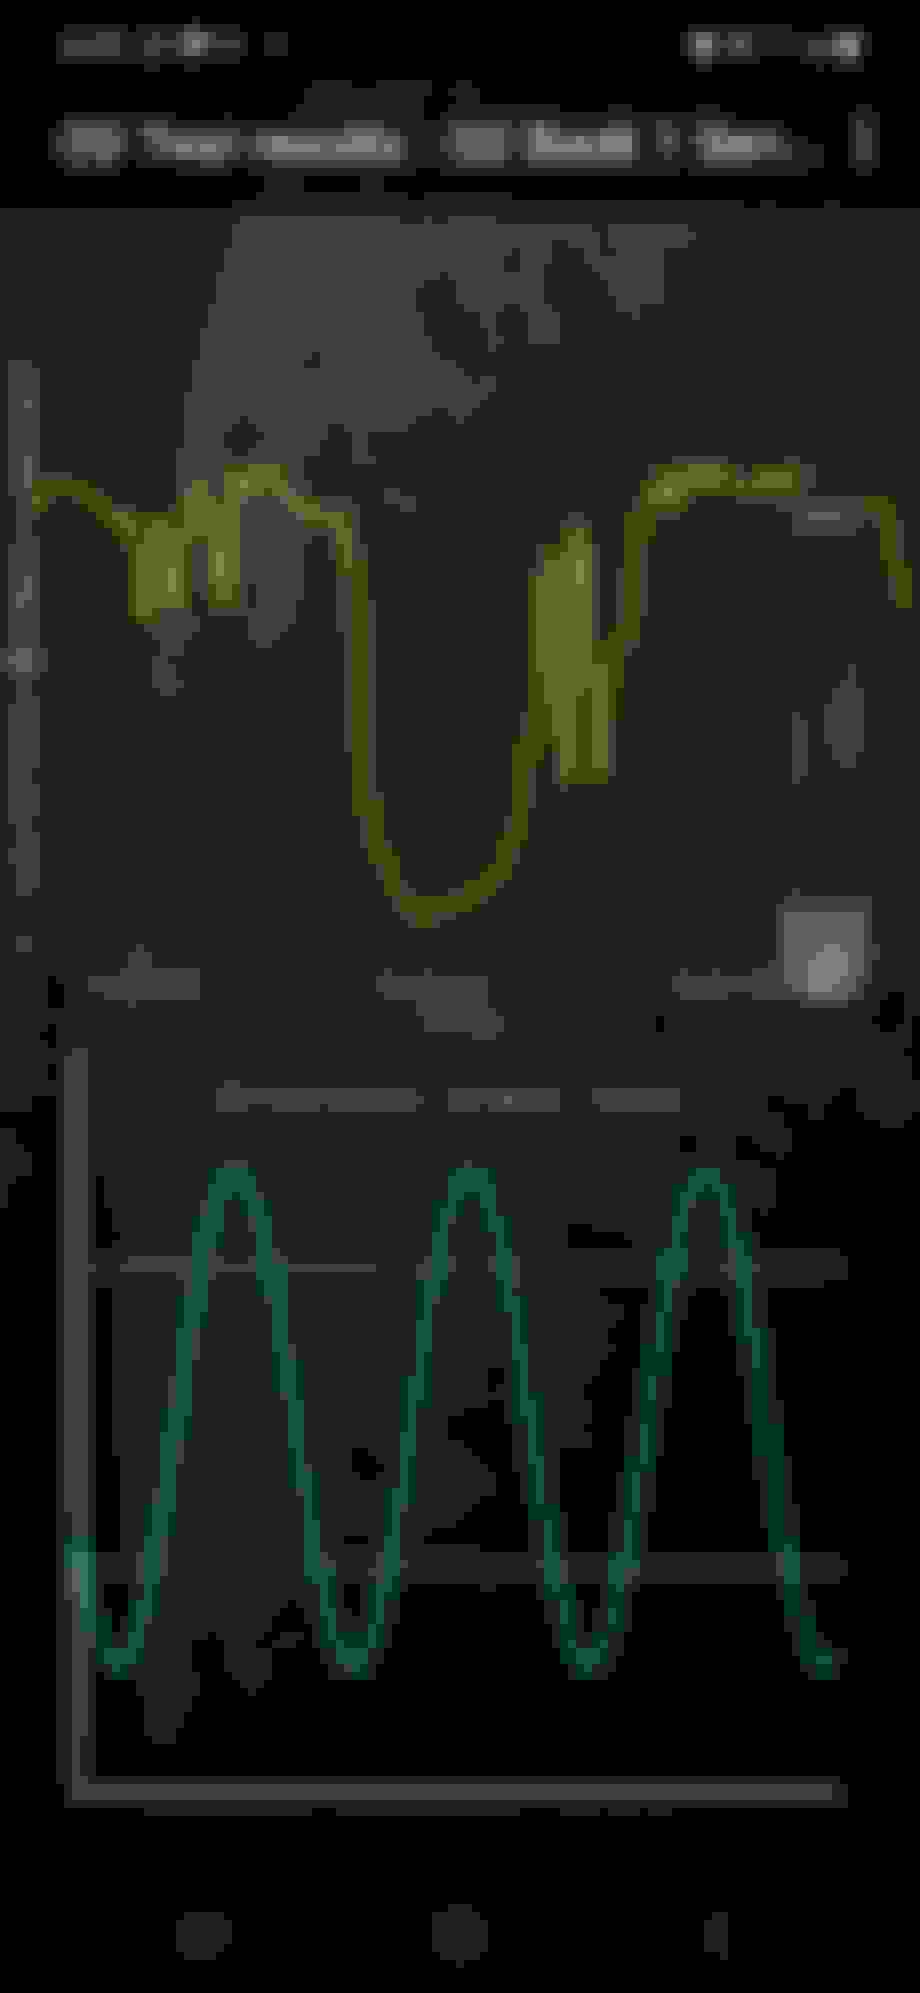
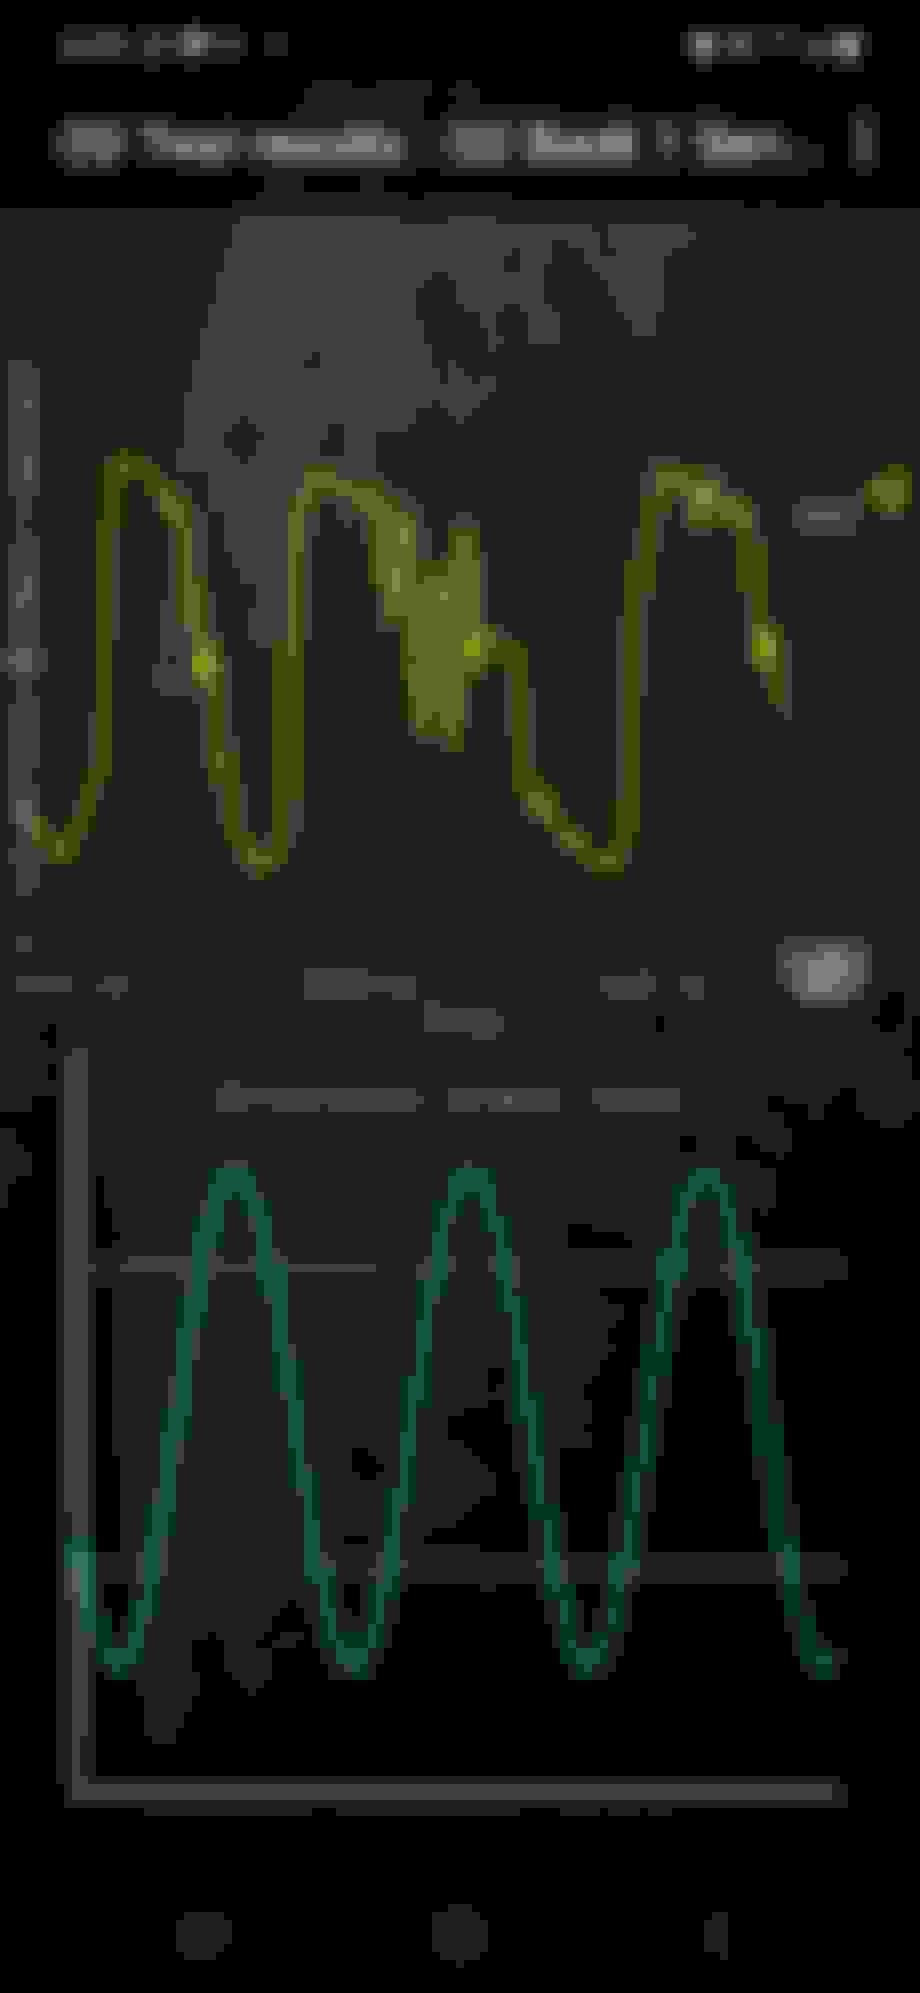
At first glance, bank 2 looks good. Bank 1 has something going on . The values are bouncing around all over the place. You might try swapping the sensors and graphing again to see if it's a sensor problem.
ok it's a bit of a mess.
Before taking any readings, let the engine warm up fully to operating temperature and make sure fuel metering is running in closed loop.
Does the software allow you to put both Bank 1 & 2 on the same graph? If yes do that, and ideally put ECT on there too.
At first glance, bank 2 looks good. Bank 1 has something going on . The values are bouncing around all over the place. You might try swapping the sensors and graphing again to see if it's a sensor problem.
Okay, I will do that. Motor was at normal temperatures. What do you mean closed loop on the fuel. I'll graph again. I think it will allow me to do both at the same time. Question: Do I need to be driving or can I just do this at idle after engine is at running temp.? I will also get ECT.
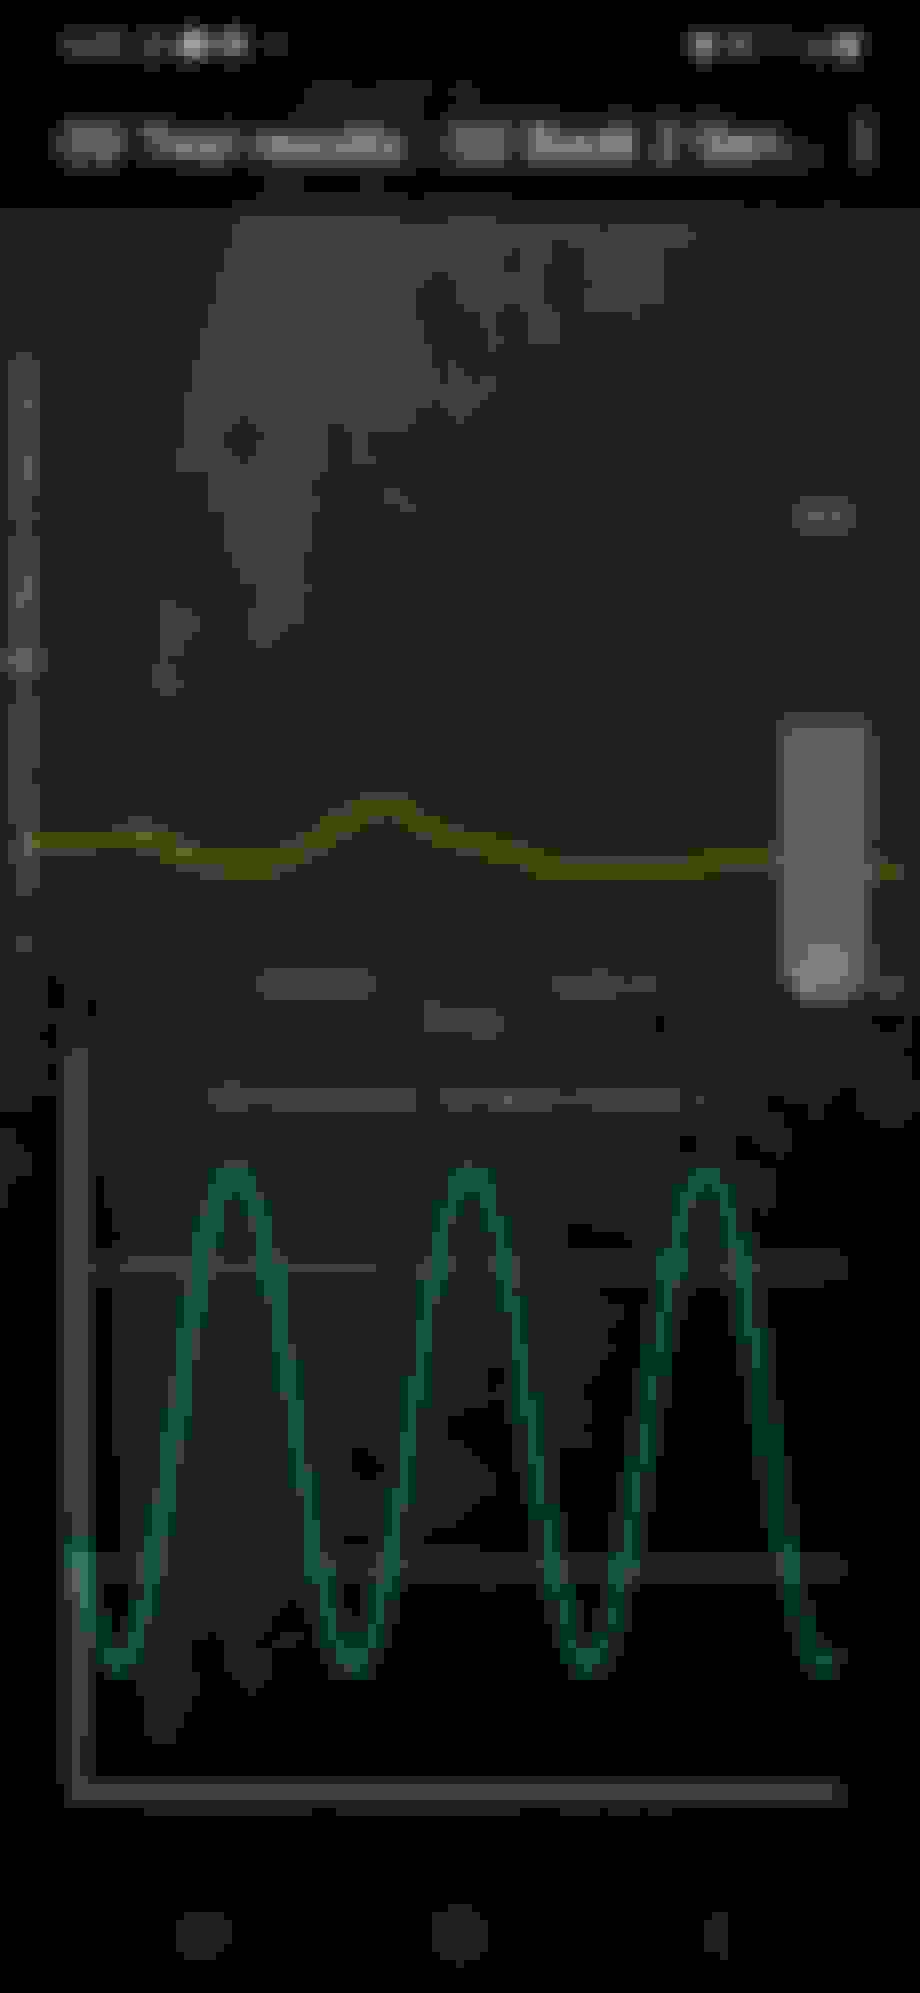
that's strange, because you can see that the graphs start out looking awful. Like around 19:00. But they eventually settle down around 19:10. So what changed in those 10 minutes?
Your yellow line should look like the blue line.
Originally Posted by outtactrl
What do you mean closed loop on the fuel.
Look around in your scan tool's live data. Fuel metering mode has to be there somewhere.
The computer uses two "modes" to decide how much fuel to inject.
The first is open loop. That's when the O2 sensors aren't ready yet as everything warms up. The computer basically guesses fuel amounts based pre-programmed tables at this point.
After the computer decides it can rely on the O2 sensors, it switches to closed loop. It begins to use the O2 , MAF and other sensor values to calculate fuel trims, and uses them as feedback to control how much fuel is sprayed into each bank.
Originally Posted by outtactrl
Do I need to be driving or can I just do this at idle after engine is at running temp.?
that's strange, because you can see that the graphs start out looking awful. Like around 19:00. But they eventually settle down around 19:10. So what changed in those 10 minutes?
Your yellow line should look like the blue line.
Look around in your scan tool's live data. Fuel metering mode has to be there somewhere.
The computer uses two "modes" to decide how much fuel to inject.
The first is open loop. That's when the O2 sensors aren't ready yet as everything warms up. The computer basically guesses fuel amounts based pre-programmed tables at this point.
After the computer decides it can rely on the O2 sensors, it switches to closed loop. It begins to use the O2 , MAF and other sensor values to calculate fuel trims, and uses them as feedback to control how much fuel is sprayed into each bank.
Idle please
Ok I understand that. Some of my readings I screenshot at idle, which are the ones I believe I sent. I also had a bubby screenshot while I was driving. I just bought a new plug-in for the app. So I'll get back on it tomorrow and see if I can clear things up some.
Thanks for your time and help.
I'll do it all at idle
mountainmanjoe,
Here are more of the graphs. I can't make heads or tails of them. I'm not an auto mechanic. I hope you van make some sense out of it. Not sure I can work this app properly.

 August 10th, 2023, 3:55 PM